The AFPS concept (NOAA, 1993) and development work comprise three broad categories: initializing graphical depictions of weather elements, editing those depictions, and generating forecast products. This paper describes current FSL work on the first of these topics.
As part of the multi-year development of the Interactive Computer Worded Forecast system (ICWF) (Ruth and Peroutka, 1993), TDL has developed MOS-based initialization methods that have been adapted for use with AFPS. FSL has begun initial work on direct-from-model initialization of surface weather elements, which is described below.
Figure 1 
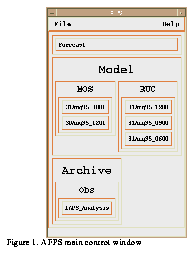
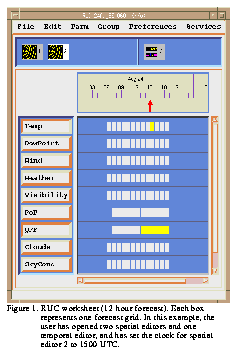
Forecasters are presented with a list of initialized, read-only, databases, as shown in Figure 1, above. Each of the selectors in this menu represents a complete database of forecast weather elements. Clicking on one database selection launches a read-only worksheet (Figure 2, below), allowing access to the individual grids in the database. After examining these first-guess forecasts, forecasters may copy their choice of data to the writable Forecast worksheet, where they may be edited, or they may choose to use these data as a (visual) guide while modifying the current data in the Forecast database.
Figure 2 
NCEP sends the native RUC output to FSL, including all hybrid-b (isentropic-sigma vertical coordinate) levels, and native variables such as the virtual potential temperature. This information is input to algorithms making forecasts of surface conditions. Presently we are diagnosing surface temperature, dewpoint, wind speed and direction, visibility, hourly precipitation amount, and up to five layers of cloud base heights and coverage.
The algorithms were developed for generating forecasts at specific stations for aviation purposes (Ramer 1993; Smith et al. 1995). AFPS is applying them to a grid using high-resolution topography, which can be higher or lower than the RUC's lowest model level, due to the model's coarse terrain. Where the high-resolution terrain is higher than the lowest model level, temperature, dew point, and so on are determined by interpolation from model results. Where the terrain falls below the lowest model level extrapolation is necessary. In the case of temperature, for example, the lapse rate in the lowest 25 hPa of the model is used for extrapolation. The details of extrapolation are now the most difficult part of surface forecast generation. Wind is not extrapolated; the nearest values from the model layers are used. This has proved to give satisfactory wind forecasts.
Forecast values are generated on a 73 by 73 10-km grid which can be located anywhere in the RUC domain. Since the AFPS grid points do not match the RUC points, the values for each AFPS grid point are determined from nearby RUC grid positions using first bilinear interpolation to the correct latitude and longitude, and then making the adjustment for elevation.
From the basic surface weather elements extracted from the RUC grids, we also derive 6-hour QPF, 6-hour PoP (Schaefer and Livingston 1990), text descriptors of weather (precipitation, type, and intensity), and a text descriptor of clouds (coverage and height for five layers) used by AFPS; these elements can be displayed on AFPS editors (see Figure 2, above). Some of these require a little thought. For example, precipitation amount everywhere may be much less than 0.01 inches each hour, and yet the QPF will sum to over 0.01 inch in places. Without special checks in the code, QPF would be nonzero, yet "weather" would indicate no precipitation. PoP is determined using horizontal averaging and threshold values of precipitation amount which are adjusted for best results. Forecasters eventually will be able to views the forecasts, adjust such parameters, and create the forecast which best agrees with their judgment and model output.
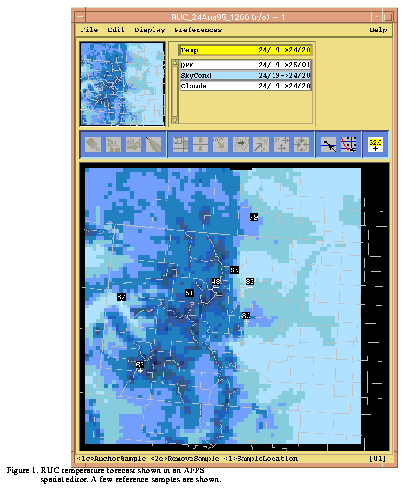
The final forecasts derived from RUC and displayed by AFPS are highly detailed, as illustrated in Figure 3, both due to model resolution and topographic effects. Using AFPS, these automatic surface forecasts can be easily examined, enabling better evaluations and revisions of the algorithms.
Figure 3 
It is clear that, in general, the forecasts correctly represent the weather. The remaining concern is how accurately this system forecasts numeric weather values, and if it can be used as a basis for preparing forecasts without significant adjustments or additional information.
The difference between the forecast and the observation is recorded for each hour and forecast at each station. The biases or average forecast-observation differences for each weather element at each hour are determined for each station, an indication of the accuracy of the forecast. Also recorded are the average absolute differences, RMS errors, and standard deviations, indications of the precision of the forecasts.
To date only hot summer conditions have occurred during these tests. As a whole, the forecasts have been acceptable. No correlation with elevation has been seen, indicating that the strong influence of elevation has been properly handled. The only significant biases noted so far are surface temperatures are consistently too high between 0600 UTC and 1200 UTC, and too low during the afternoon. A problem in the handling of the ground substrate temperature in the RUC has been identified that is likely responsible for this behavior. An updated version of the RUC model scheduled for September 1995 will include improvements to surface temperatures. Forecasts of precipitation amount and wind are very good, though both tend to be light at this time of year in Colorado. No significant episodes of reduced visibility has occurred at the time of writing, so model forecast success of visibility has not been tested.
We will continue gathering comparison statistics through the fall and early winter seasons. It is premature to give measures of fit of the forecasts to observed conditions now. We will report detailed comparisons at the conference. The results of our analysis of forecast quality will be used, and already have been used, to improve both the RUC and the algorithms to estimate surface conditions from the RUC model output. By the time this paper is printed, we plan to derive similar surface forecasts from Eta or NGM grids; other models will follow. From all, we will evaluate the fit of forecasts to observations, and revise the surface algorithms where necessary.
FSL plans to install the WFO-Advanced system and the AFPS in the Denver WSFO in the spring of 1996, for evaluation by forecasters. We hope to begin operational testing of AFPS and these initialization algorithms by mid-1996. As noted in the introduction, long-range plans call for AFPS to be added to AWIPS toward the end of the decade.
Initial surface forecasts based on RUC, NGM, Eta, and other numerical models are expected to be one of the strengths of using AFPS. Preliminary results indicate that surface conditions derived from numerical model output will provide satisfactory initial values for forecaster use in AFPS.