GNSS QA Plotting programs Anubisplot and teqcplot.py
by Stuart Wier July 2, 2016
Anubisplot
Anubisplot version 1.0 is available as of May 2016.
Right click on images to "view image" and see the full size.
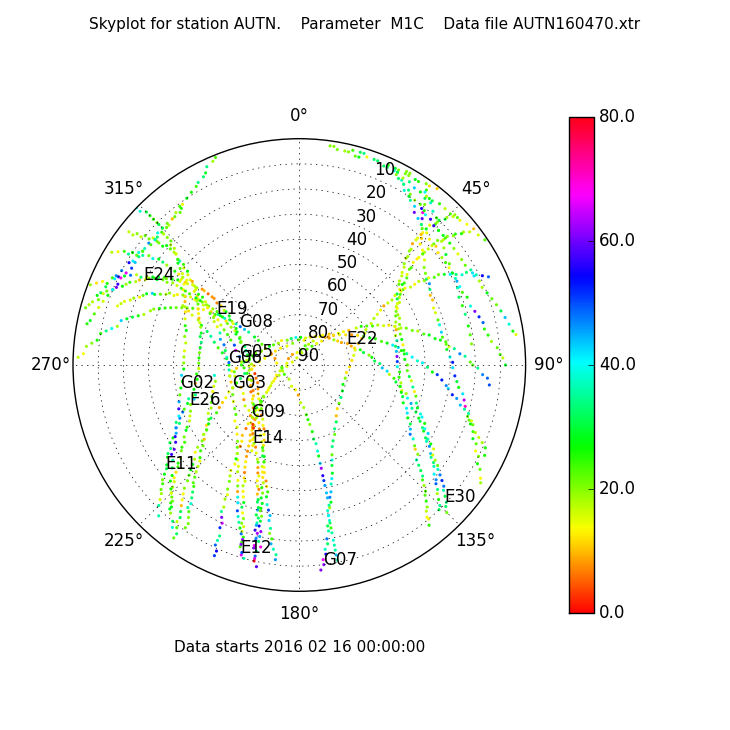
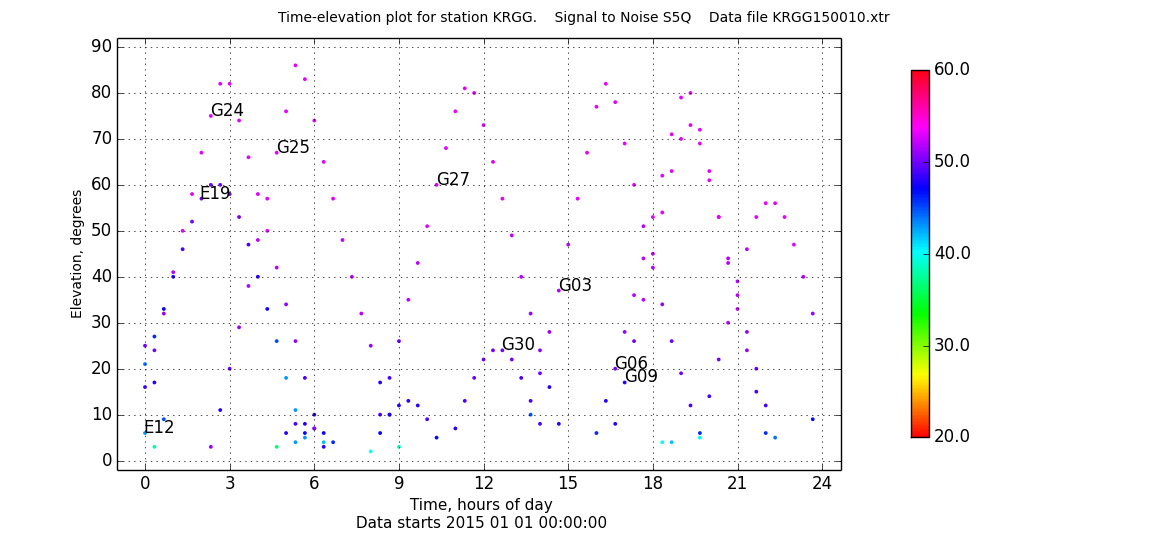
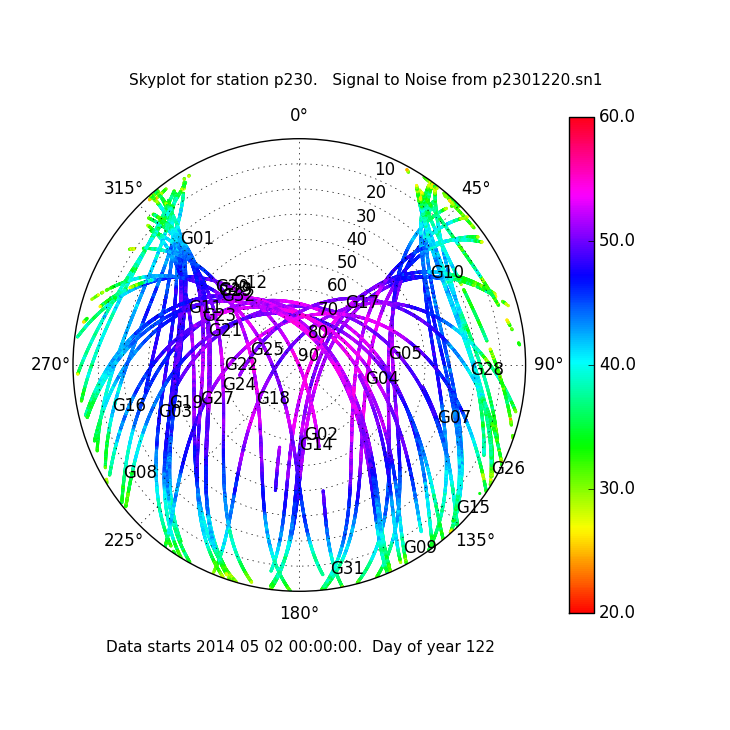
Anubisplot is an open-source Python freeware program for visualization of Anubis processing of GNSS receiver files. Plotted data includes sky tracks, signal to noise estimates, and multipath estimates. Graph types include skyplots, by time, by azimuth, and band plots. Anubisplot.py can be run interactively for single plots, or programmatically with scripts for automated plot generation.
Here is the link to the anubisplot.py file. Anubisplot runs on Linux, Mac, and Windows. Anubisplot uses recent versions of Python with the Python libraries numpy and matplotlib on your system. You may need to install or upgrade Python, numpy, and the matplotlib 1.3 library. Download the Anubisplot Instructions here.
Anubis
is a tool for a quality analysis of modern data from all available GNSS constellations providing full quantitative and qualitative control.
Values computed include SN, multipath, and satellite elevations and azimuths if supported with all constellation navigation messages.
Teqcplot.py
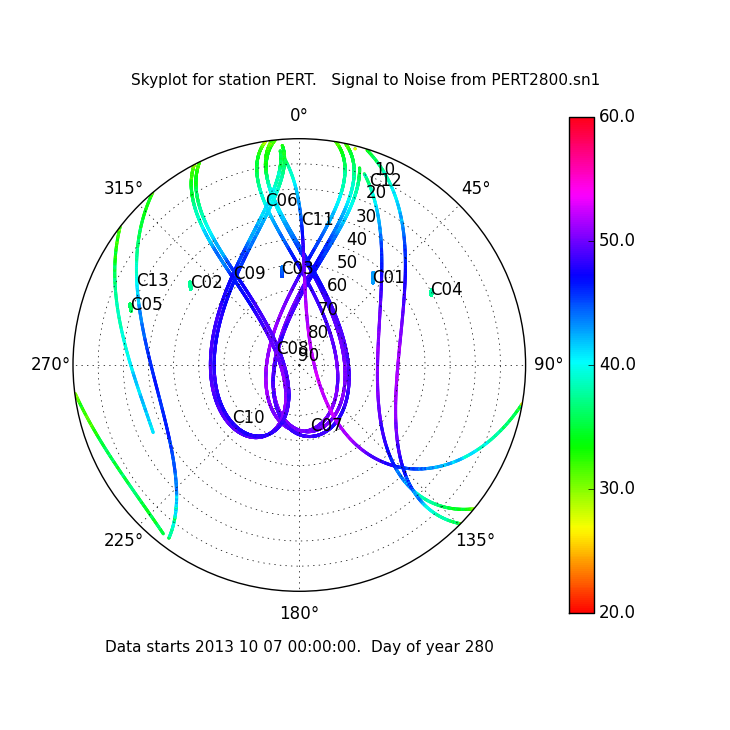
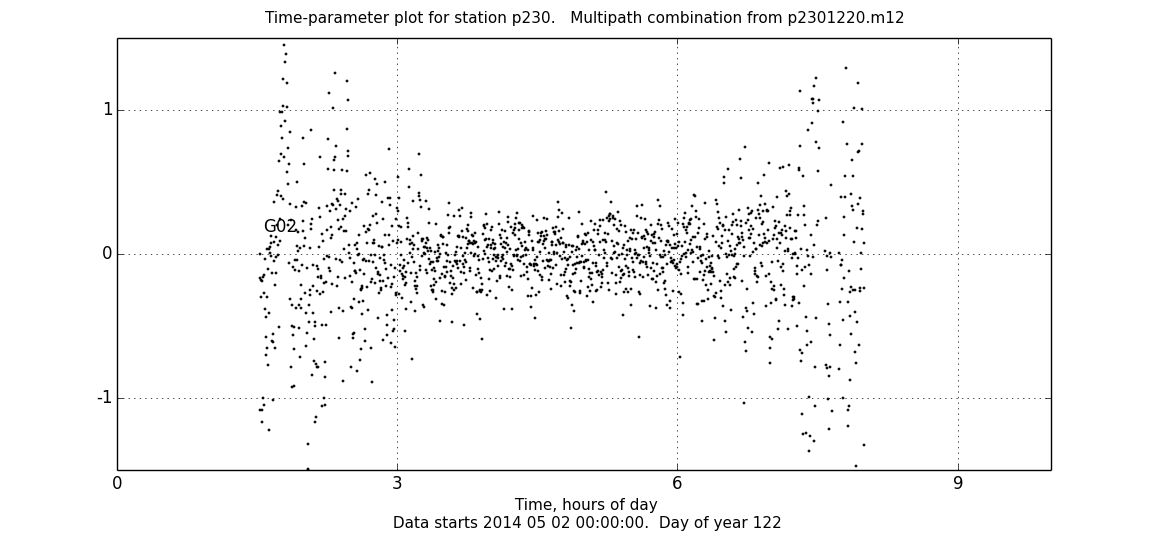
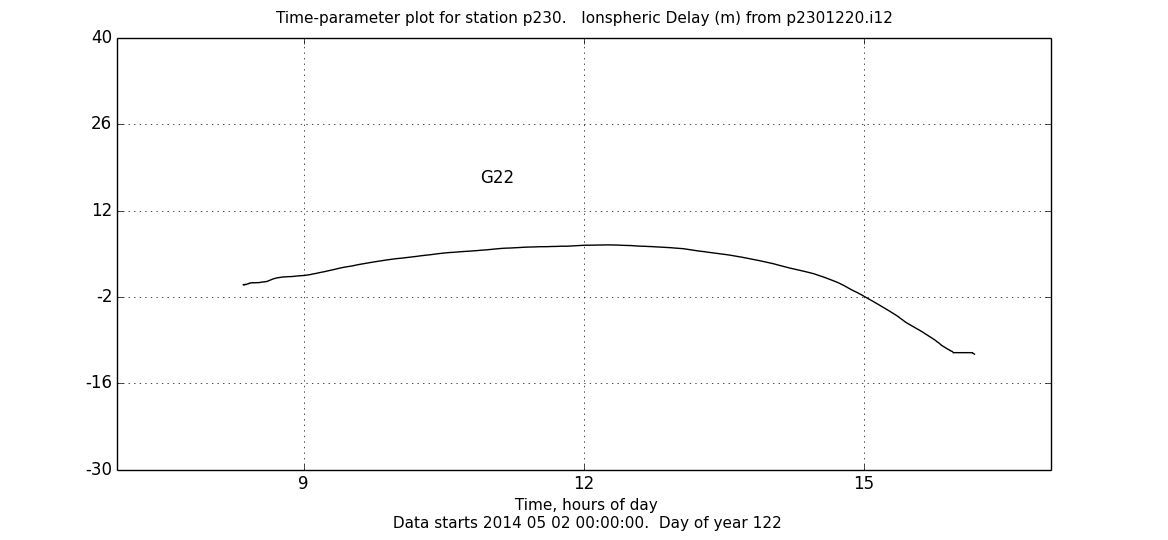
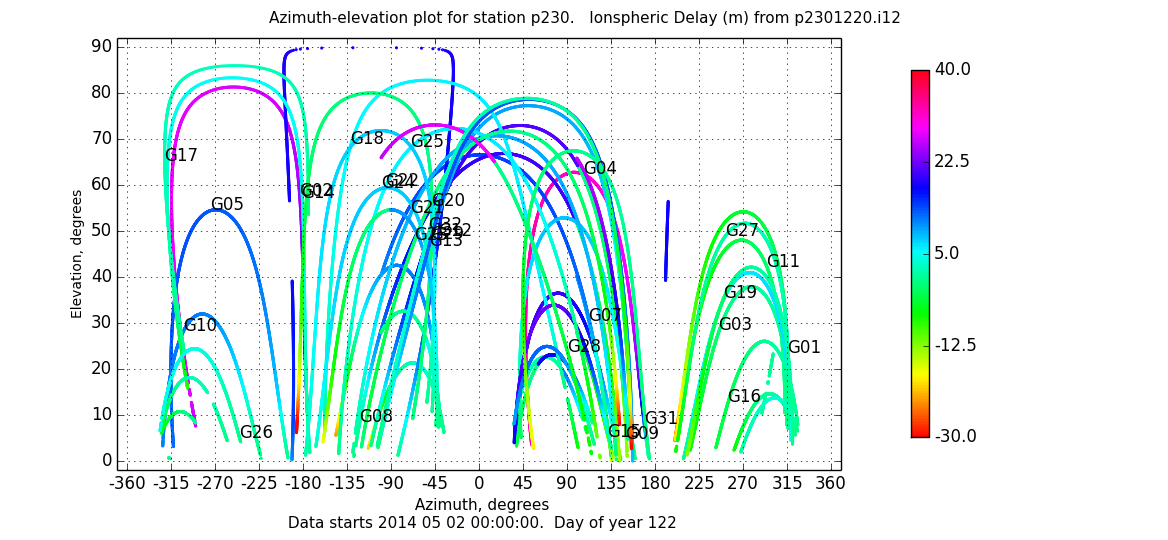
Right click on images to "view image" and see the full size.Teqcplot.py is an open-source Python freeware program for visualization of "teqc qc" results.
(teqc is a program for pre-processing GPS, GLONASS, Galileo, Beidou-2/Compass, and QZSS data. teqc is used by geodesists doing high-precision point positioning with GNSS. teqc processes RINEX, BINEX, and native receiver files and streams. Teqc is freeware from the UNAVCO web site. Teqcplot.py is not part of teqc, does not use teqc code, and is not supported by teqc software development.)
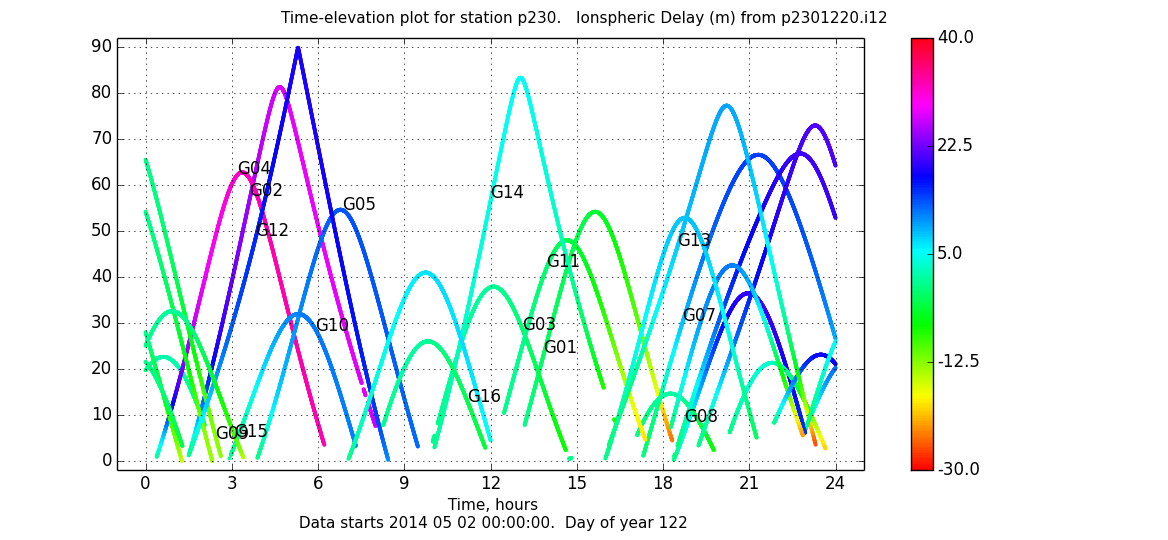
Teqcplot.py makes displays of data from "teqc qc", quality analysis of GNSS receiver output. Teqcplot.py can be run interactively for single plots, or programmatically with scripts for automated plot generation. Plotted data includes sky tracks, signal to noise estimates, multipath estimates, and ionosphere delay values. Plot types include skyplots, by time, by azimuth, and band plots. Teqcplot.py plots data from files made by teqc in COMPACT3 format, the current format for teqc +qc +plot output. Teqcplot.py does not read the older COMPACT and COMPACT2 formats from older versions of teac, but you are free to revise the Python code of teqcplot.py to read any other file format.
Teqcplot.py can be run on Linux, Mac, and Windows. Teqcplot.py uses recent versions of Python, numpy, and matplotlib on your system. You may need to install or upgrade Python, numpy, and the matplotlib 1.3 library.
A Known Bug
Running a teqcplot command (such as teqcplot.py +timeparmplot bjfs0990.azi bjfs0990.ele bjfs0990.m12) may produce this incorrect "error" message:
Problem: the input .azi and parm files have differing count of lines; should be the same.In fact, teqc parameter files may have fewer epochs than the .azi file for "incomplete" data, but some data should still be plotted by teqcplot. So far teqcplot does not handle this case. Teqcplot was developed with 'complete' data so this case was not encountered in data files used for testing. This bug was first reported 23 months after teqcplot.py was first released.
"The .azi and .ele files should have the same number of epochs. All the .iNM, .mNM, and .snN files would have the same number of epochs as the .azi and .ele files for complete data, or less for incomplete data. All the .dNM files should have one less epoch than the corresponding .iNM files. If the number of epochs in the .nNM, .mNM, .snN, or .dNM files are quite different from the .azi and .ele files, then this is probably an indication of very incomplete data. Teqc does the best with what it has, but there's not much that can be done for incomplete data." (from Lou Estey).
This bug can be corrected with some careful recoding of the teqcplot.py code. This is expected to be tricky. You are welcome to do so if you are experienced with Python data structures. When the author of teqcplot.py is able to work on this is unknown as of now.
Installation and Use
The latest teqcplot.py Python file is at http://www.westernexplorers.us/teqcplot/teqcplot.py. Right click on the link to download the file.
For teqcplot.py installation and use see the Teqcplot Documentation. Right click on the link to download the documentation, a plain text file. teqcplot.py is a command line program with command line arguments like the arguments used by teqc. Once teqcplot.py runs on your system, the command teqcplot.py alone will show help material.
See sample plots below, and more at teqcplot_py_sample_plots.html.

Anubisplot.py and teqcplot.py are free software. You can redistribute either one and/or modify it under the terms of
the Gnu General Public License version 3.0.
You must retain the original and complete Copyright and License Notice in all cases.
This web page is at http://www.westernexplorers.us/GNSSplotters/.
Copyright © 2015-2016 Stuart Wier